


Introduction
Epilepsy diagnosis after one unprovoked seizure is challenging, even though practical guidelines for the definition of epilepsy have been proposed by the International League Against Epilepsy. There are no sensitive biomarkers, and the diagnosis depends, to some extent, on the clinician’s individual experience. These factors may delay prompt start of treatment. While the electroencephalogram (EEG) is a very specific diagnostic tool, only 30–50% of patients with epilepsy present interictal epileptiform discharges (IEDs) on their first EEG.1 Thus, the development of more sensitive EEG measurement techniques would be of great value.
Epilepsy is currently considered a brain network disorder.2 A growing body of evidence suggests epilepsy affects ‘functional connectivity’, 3–6 which refers to the statistical interdependencies among remote neurophysiological events.7 There are recent results suggesting that functional connectivity analysis of EEG could improve epilepsy diagnosis in the absence of IEDs.8 Functional connectivity analysis using synchronization likelihood has helped identify the relationship between increased theta band connectivity and epilepsy diagnosis in patients after a first unprovoked seizure.9
However, studies investigating functional connectivity after the first unprovoked seizure in epilepsy patients are insufficient, and there is no currently established standard of interictal resting-state brain network behavior which may aid in epilepsy diagnosis. Therefore, we investigated the differences of functional connectivity after the first unprovoked seizure between patients diagnosed with epilepsy due to subsequent seizures and those who were not.
Methods
Patients
This retrospective study used the quantitative electroencephalography (qEEG) data of patients who visited the Department of Neurology from July 2016 to August 2020. This study was performed in accordance with the Helsinki Declaration of 1975, as revised in 2000. From this database, we selected those patients (age ≥18 years old) who underwent qEEG because of a possibility of epilepsy after a first unprovoked seizure. Patients with non-epileptic attacks and acute symptomatic seizures were not included. The seizure type of all patients was focal to generalized tonic-clonic seizure or unknown onset generalized tonic-clonic seizure. No patients presented IEDs on their EEG or any structural abnormalities on magnetic resonance imaging, such as malformation of cortical development, hippocampal sclerosis, stroke, brain tumors, or hydrocephalus. Those who met the criteria for epilepsy syndrome or whose first seizures presented as status epilepticus were excluded. Patients with major psychiatric disease or neurological disorders were also excluded (Fig. 1). We reviewed the medical chart for all patients to identify whether the patients had been clinically diagnosed with epilepsy within a follow-up period of 1 year (defined as two or more unprovoked seizures according to the practical guidelines of the International League Against Epilepsy).
Patients were divided into the epilepsy group and control group. The epilepsy group included patients who were not diagnosed initially after the first seizure, but were diagnosed during the follow-up period (two or more unprovoked seizures occurred within 1 year of the first). In the epilepsy group, none of the patients were suspected of having generalized onset epilepsy. The control group included those who were not with as epilepsy during at least a 1-year follow- up period.
qEEG analysis
Interictal resting-state EEG was conducted using the standard 10–20 system (21 electrodes) and a digital electroencephalograph (Comet AS40 amplifier EEG GRASS; Telefactor, Middleton, WI, USA) (Jaspers, 1958), and all electrodes were referred to linked ear references. Electrode skin impedance was always below 5 kΩ. The EEG signal was analog-filtered with a band pass of 0.5–70 Hz and digitized and stored on magnetic disks for further analysis. EEG sampling was conducted with eyes open for 30 seconds and with eyes closed for 30 seconds, 10 times each, at a rate of 200 Hz. Of these, about 3 minutes of eyes-closed data was used. One epoch is 4 seconds long, and an average of 45 epochs were analyzed. The eyes-open and eyes-closed data were calibrated according to the linked ear reference measurements and stored in text format without filtering. During the recording of resting-state EEG data, patients were lying down in a resting position in a sound-attenuated room. EEG noise preprocessing and group analyses were conducted using iSyncBrain® (iMediSync Inc., Suwon, Korea; https://isyncbrain.com/), a cloud-based, artificial intelligence EEG analysis platform. The eyes-closed EEG segments were uploaded to iSyncBrain®. Prior to data analysis, artifacts in the raw data were removed by visual inspection and an adaptive mixture independent component analysis. In the source-level analysis, the current distribution across the brain was assessed using the standardized low-resolution brain electromagnetic tomography technique,10 to compare relative power values in 68 regions of interest (ROIs)11 and connectivity (the imaginary part of coherency, iCoh)12 between ROIs. Relative power at eight frequency bands (delta [1–4 Hz], theta [4–8 Hz], alpha1 [8–10 Hz], alpha2 [10–12 Hz], beta1 [12–15 Hz], beta2 [15–20 Hz], beta3 [20–30 Hz], and gamma [30–45 Hz]) was calculated using a power spectrum analysis. EEG coherence has been studied as a measure of brain connectivity, 13 and the iCoh has been introduced to avoid volume conduction artifacts.12 The iCoh is defined as follows:12
where (Sxy(f)) is the cross-spectral density and (Sxx(f)) and (Syy(f)) are the power spectral densities of the signals for each channel X and Y, respectively. We calculated the connectivity of each of the regional 68 ROIs pairwise with the remaining 67 ROIs. We then estimated the functional connectivity at the eight frequency bands.
Statistical analysis
To compare demographic results between groups, Student’s t tests for continuous variables were performed with IBM SPSS version 25 (IBM, Armonk, NY, USA). Statistical significance was set at p<0.05. Student’s t test was performed for the frequency band power of each of the 68 ROIs and iCoh between the 68 ROIs, to compare the epilepsy and control groups. All statistical processes for qEEG features were input into iSyncBrain®.
Results
Patient characteristics
In this preliminary study, the qEEG database after first unprovoked seizure included 29 patients. Patients were classified into two groups; 12 in the epilepsy group and 17 in the control group. The mean age of the epilepsy group was 35.6 years (standard deviation [SD], 14.5) and 34.9 (SD, 17.7) in the control group. There was no significant difference in sex between the epilepsy and control groups. The proportion of male sex was 64.7% (11/17) in the control group and 75% (9/12) in the epilepsy group.
Source power analysis
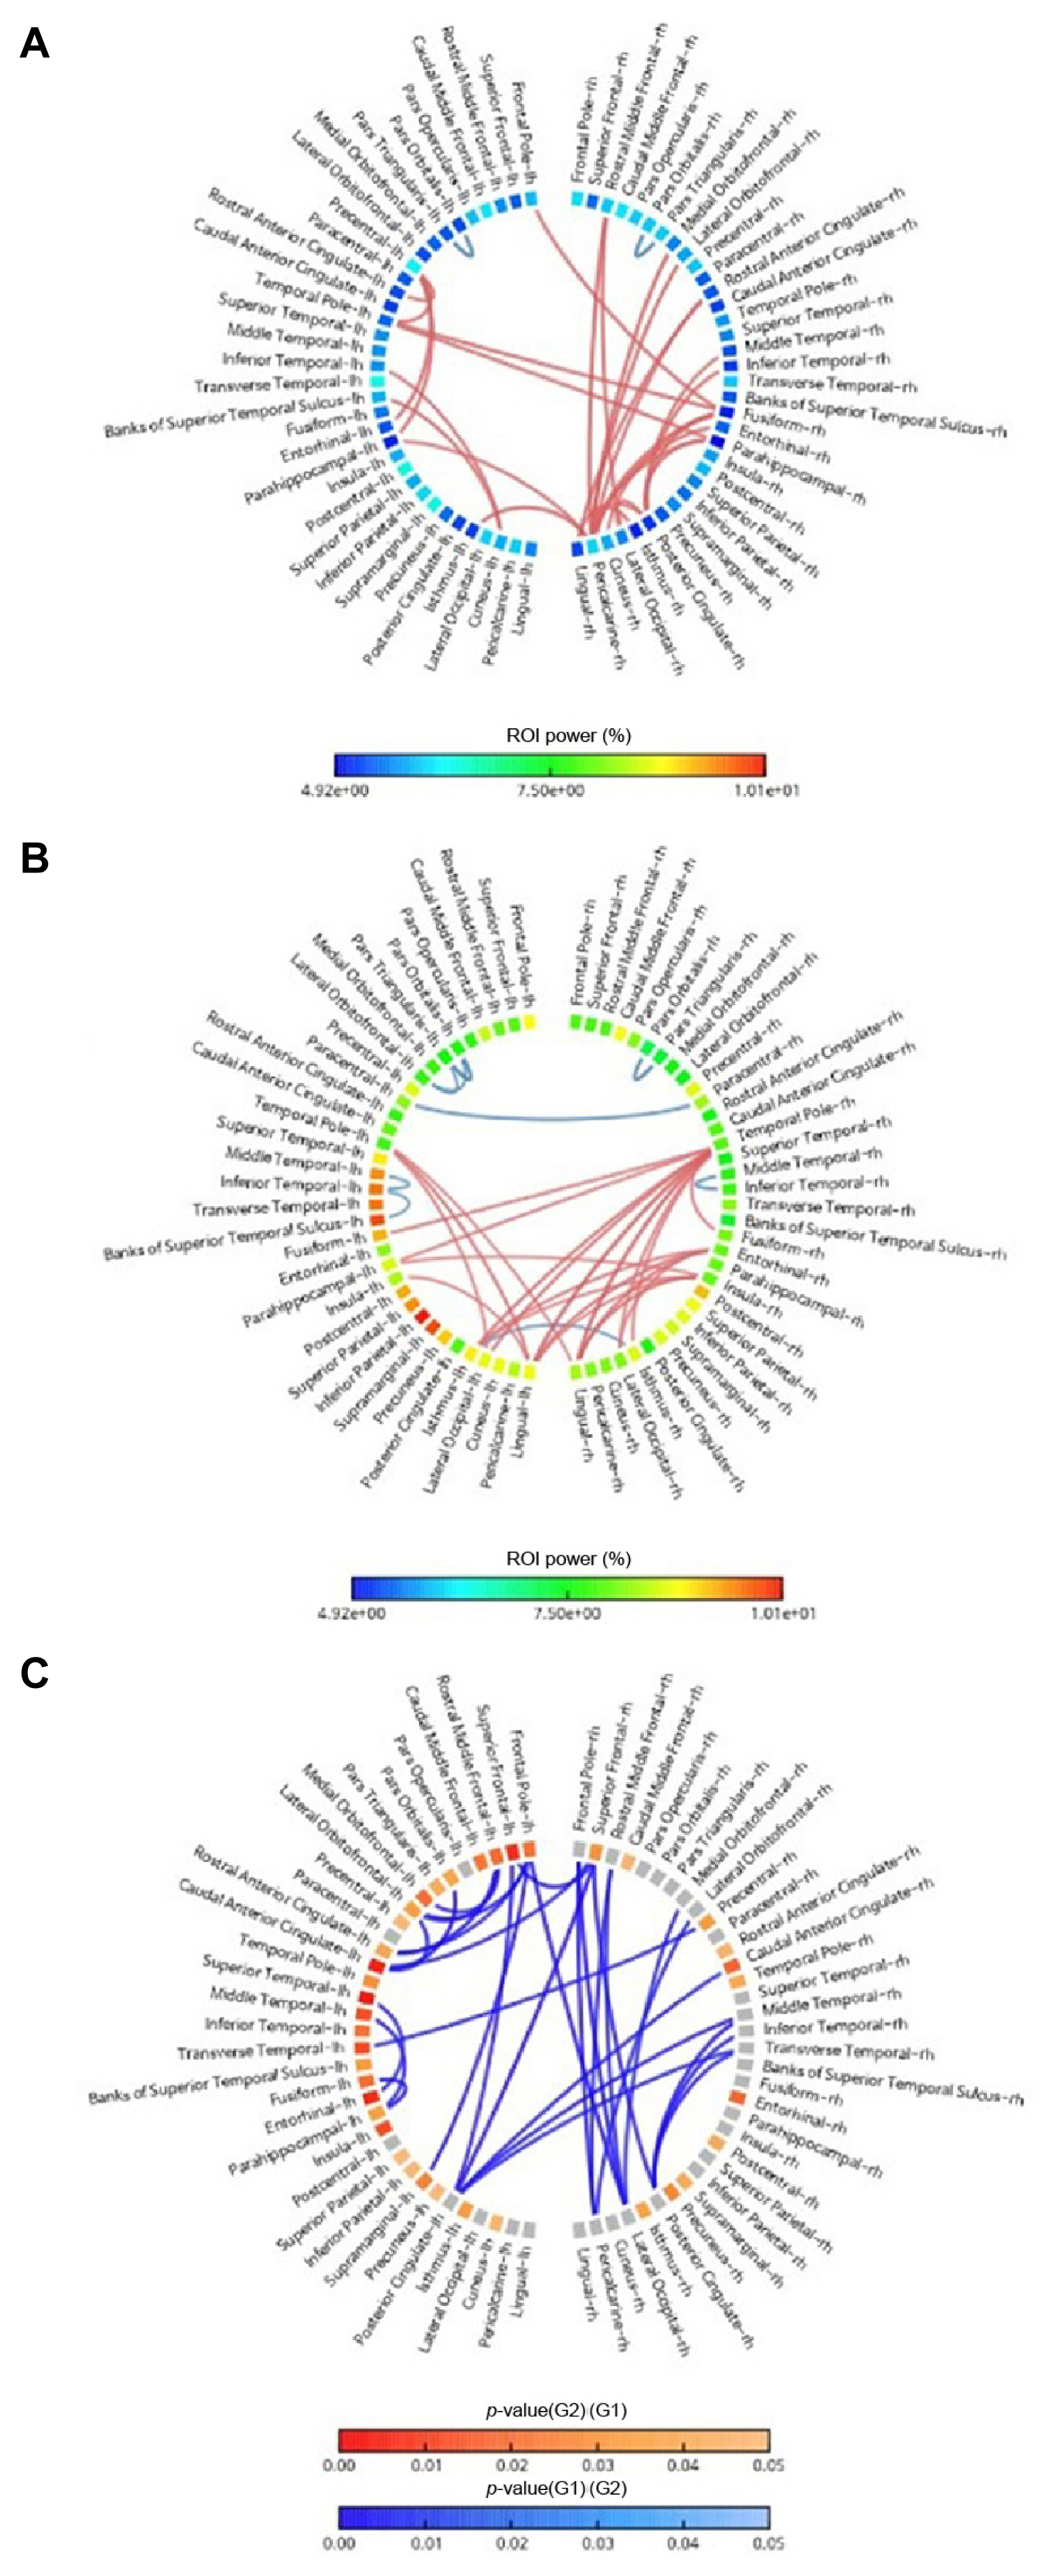
The epilepsy group showed significantly lower relative alpha2 power than the control group (Fig. 2). The alpha2 power value was lower across all sources of the left hemisphere and both occipital areas (Fig. 2A, B). Furthermore, a significantly lower value (p<0.05) of alpha2 power in the left frontal, left central, left superior temporal, and left parietal regions was observed in the epilepsy group (Fig. 1C).
The average beta2 power value was higher across all sources in the epilepsy group (Fig. 3A, B). Significantly higher values (p<0.05) were recorded in both frontal, both precentral, right postcentral, both temporal, left parietal, both isthmus, and left cuneus regions in the epilepsy group (Fig. 3C).
There were no significant power differences in the delta, alpha1, beta1, beta3, and gamma bands between the groups.
Source connectivity
There was a different network pattern after the first unprovoked seizure in the epilepsy group versus control group (Figs. 1, 2). In the control group, strong alpha2 connections were found between the parieto-occipital and temporal regions (Fig. 1A), and strong beta2 connections were found between occipital and temporal or frontal regions (Fig. 2A). In the epilepsy group, there were strong alpha2 connections between temporal regions and parietal or occipital region (Fig. 1B). The epilepsy group also showed strong beta2 connections between temporal and occipital regions (Fig. 1B).
Compared with the control group, the epilepsy group showed a lower connectivity in the alpha2 band between the frontal and frontal networks, and the frontal and parietal networks (Fig. 1C). The epilepsy group also showed lower beta2 band connectivity than the control group between the frontal and frontal, frontal and parietal, and frontal and occipital networks (Fig. 2C).
Discussion
In our study, the functional connectivity of the alpha and beta bands was significantly lower in the group with later diagnosed epilepsy than the control group. Moreover, the epilepsy group showed significantly lower alpha band power and higher beta band power values. Until now, epilepsy often cannot be diagnosed after the first unprovoked seizure occurs, and epilepsy is often diagnosed only after a second seizure. Consequently, patients are often exposed to seizure attacks without being diagnosed with epilepsy; therefore, research on a highly sensitive diagnostic method for epilepsy is needed. Our results found a different pattern of brain network connectivity after the first unprovoked seizure between the epilepsy and control groups, suggesting the possibility of diagnostic value of resting-state EEG after a first unprovoked seizure in the absence of IEDs.
Currently, there is no established definition of “resting-state” interictal brain network activity.14 Significantly diminished connectivity in the default mode network has been observed in temporal lobe epilepsy along with a different pattern between patients and controls.15 Clemens et al.16 identified increased connectivity of alpha band and reduced beta band connectivity in patients with generalized epilepsy using source-based connectivity analysis. Some studies found increased functional connectivity,4,6 while others found decreased5,17 or mixed patterns of increased and decreased functional connectivity.15 These differences may be affected by various clinical variables (e.g., the type of epilepsy or seizure, seizure frequency, seizure freedom, medication) and analysis methods.18 Further investigations to standardize the definition of interictal resting state brain network connectivity in epilepsy patients is needed. Such research may contribute to understanding the epileptic brain network in the absence of IEDs after a first unprovoked seizure.
There are promising results suggesting functional connectivity for improving the diagnosis of epilepsy even in the absence of visible EEG abnormalities.8,9 In a functional connectivity study using synchronization likelihood, increased theta band connectivity was related to diagnosis of epilepsy after a first unprovoked seizure. Even in the absence of visible IEDs, functional connectivity could predict epilepsy with sensitivity of 51% and specificity of 73%.9 In another study, increased theta band connectivity was associated with a higher number of seizures in patients with brain tumors, indicating a potential biomarker for tumor-related epilepsy.19 In our study, EEG source connectivity analysis after the first unprovoked seizure and alpha and beta connectivity was significantly lower in the epilepsy group than in the control group. In our study EEG source connectivity analysis was performed using iCoh, which is linear relationship measure between two nodes, but there are many different measures of brain connectivity. Douw et al.9 used synchronization likelihood, which is a generalized synchronization method to detect nonlinear correlations. Despite methodological differences, these studies suggest the added diagnostic value of EEG connectivity analysis in source space.
The current study has certain limitations. The main limitations were derived from retrospective data and the inclusion criteria. Some people in control group may have experienced second seizure in the long term (more than 1 year) after the first, so some people in the control group may have been misclassified due to the short observation period of less than 1 year. Differences in functional connectivity between the two groups would have been more reliable in a prospective study. Additionally, all patients in epilepsy group had a tentative diagnosis focal epilepsy, but they were not classified according to location of epileptic zone. For the purpose of identifying epilepsy in the real world, patients were simply divided into two group, normal and epileptic group, which caused heterogeneity in the epileptic group. Secondly, our data were obtained from a small number of patients. However, despite the small sample size, our study also identified a very different pattern of connectivity alterations, strengthening the potential diagnostic role of EEG source connectivity analysis for epilepsy after a first unprovoked seizure in the absence of visible IEDs. In the future, large-scale and longitudinal follow-up studies may be needed to investigate the predictive cut-off point of functional connectivity. Thirdly, there were methodological limitations related to analysis of the scalp signal. Furthermore, extensive methodological variation may exist among studies, including ours, and this may lead to discrepancies among studies. However, since there is currently no standard pattern of network connectivity and standard analytical method, it is speculated these results may contribute towards future studies on the diagnostic value of EEG source connectivity analysis after the first unprovoked seizure. Future studies should address more clinical factors to allow better comparability.
In our preliminary study, we identified the differences in functional EEG connectivity between the later diagnosed epilepsy group and the control group. Our results also proposed its potential clinical utility in predicting epilepsy after a first unprovoked seizure in the absence of IEDs. For improving the diagnosis of epilepsy and establishing a standard interictal resting-state brain network, further investigations are needed.